Complete Vibration Analysis of a Car Chassis Using ANSYS: Durability, Sustainability, and Suspension Systems
By Epsilon X Sky — Customized Ingenuity for a Smarter Life

Every car chassis carries a silent contract with the road beneath it. That contract is written not in design drawings or material certificates, but in millions of load cycles, vibration events, resonance interactions, and fatigue accumulations that begin the moment the vehicle first moves and continue relentlessly until the structure either endures or fails. Traditional design approaches relied on physical prototypes, expensive test rigs, and iterative fabrication cycles to expose weaknesses that should have been caught earlier. Today, ANSYS Mechanical gives engineers the power to simulate that entire lifecycle — every frequency, every stress peak, every fatigue crack initiation site — before a single piece of steel is cut. At Epsilon X Sky, we recently completed a comprehensive vibration and durability study on a car chassis that demonstrated precisely how far simulation-driven engineering has advanced, and how much it changes the quality of decisions made at the design stage.
1. Understanding the Vibration Environment: Why Chassis Dynamics Are More Complex Than They Appear
The vibration environment that a car chassis experiences in service is not a single load case. It is a continuous, multi-directional, frequency-rich assault from sources that interact with each other in ways no static analysis can ever capture.
Road surface roughness transmits broadband random vibration through the tyre contact patch, up through the suspension geometry, and into the chassis structure at amplitudes and frequencies that vary continuously with vehicle speed, road condition, and tyre pressure. Engine firing pulses introduce periodic excitation at frequencies directly linked to engine speed — typically between 25 Hz and 200 Hz across the normal operating range — and these pulses propagate through engine mounts into the chassis rails with amplitudes that depend on mount stiffness and isolation efficiency. Driveline imbalance adds further periodic inputs at frequencies related to driveshaft rotation, and braking events introduce transient impulse loads that excite multiple natural frequencies simultaneously.
What makes chassis vibration analysis genuinely challenging is not the complexity of any single source, but the fact that all these sources act concurrently and their effects combine in ways that are highly sensitive to the specific geometry and stiffness distribution of the structure.
A chassis that behaves benignly under engine excitation alone may exhibit severe resonance when road input and engine excitation frequencies coincide near one of its natural frequencies. The structural response at any given location depends on the global mode shapes — how the entire chassis deforms at each natural frequency — which in turn depend on section properties, weld stiffness, joint geometry, and the mass distribution of all attached components including the engine, gearbox, fuel tank, and body panels.
This is why vibration analysis must begin with a clear understanding of the excitation envelope before any simulation is run. At Epsilon X Sky, we start every chassis study by mapping the frequency content of all significant excitation sources across the full operating range. Engine speed sweeps, road surface classifications from ISO 8608, driveline rotation frequencies at multiple gear ratios, and braking pulse durations are all documented and translated into the boundary condition inputs that drive the simulation. This front-end work is not glamorous, but it determines whether the simulation results are genuinely predictive or merely plausible-looking outputs that give false confidence.
The structural response is equally governed by the chassis's own dynamic properties — its natural frequencies, mode shapes, and damping characteristics. A natural frequency sitting inside the engine operating range is a problem waiting to manifest as noise, vibration, and harshness. A mode shape that places maximum deformation at a suspension mounting point amplifies the dynamic load seen at that joint by factors of two, three, or more compared to the static equivalent. Identifying these configurations before fabrication is the fundamental purpose of the modal analysis that opens every complete vibration study.
Damping is the least-understood and most underappreciated parameter in chassis vibration. Structural damping from weld interfaces, joint friction, and material hysteresis limits resonance amplitudes that would otherwise be catastrophically large. Chassis structures typically exhibit damping ratios in the range of one to three percent of critical damping — enough to prevent unbounded growth but not enough to make resonance avoidance unimportant. In our ANSYS models, we apply conservative damping values derived from experimental correlations rather than optimistic assumptions, ensuring that predicted resonance amplitudes represent realistic worst-case conditions rather than best-case estimates. Understanding the full vibration environment — excitations, natural frequencies, mode shapes, and damping — is the foundation on which every subsequent analysis in a complete durability study is built.

2. Modal Analysis: Extracting Natural Frequencies and Mode Shapes with ANSYS
Modal analysis is the structural equivalent of taking a fingerprint. It reveals the inherent dynamic character of the chassis — the specific frequencies at which it wants to vibrate and the deformation patterns it adopts when excited at those frequencies — independent of any particular loading scenario.
The process begins with a finite element model that accurately represents the mass and stiffness distribution of the chassis assembly. In ANSYS Mechanical, we build the chassis geometry from detailed CAD data, assigning material properties including Young's modulus, Poisson's ratio, and density with care, because modal frequencies are directly proportional to the square root of stiffness divided by mass. An error of ten percent in material stiffness translates to a five percent error in natural frequency — potentially enough to misplace a critical mode relative to an excitation frequency and miss a resonance condition entirely.
Mesh quality in modal analysis demands particular attention at joints, weld zones, and section transitions, where the actual stiffness of the structure differs most significantly from an idealised continuum model. Weld connections between cross-members and main rails carry significant bending stiffness in reality, but representing them incorrectly as simple shared nodes or rigid connections introduces errors that propagate into every subsequent frequency response and fatigue calculation. At Epsilon X Sky, we model weld zones using carefully sized solid elements that replicate the actual weld throat geometry and apply reduced stiffness properties where appropriate to account for heat-affected zone softening.
The Block Lanczos eigenvalue solver in ANSYS efficiently extracts the required number of natural frequencies and corresponding mode shapes across the frequency range of interest. For a typical automotive chassis, we extract a minimum of twenty modes spanning zero to two hundred hertz, capturing all global deformation modes — bending, torsion, lateral sway, longitudinal breathing — as well as the lower-order local panel modes that can drive noise and fatigue at specific components.

In our recent study, the most significant finding from modal extraction was a fundamental torsional mode at 42 Hz — a frequency that falls squarely within the excitation range produced by the rear suspension system during highway driving at speeds between 80 and 120 kilometres per hour. This single finding, which took less than two hours of solver time to extract, immediately flagged a design vulnerability that would have appeared as a persistent vibration complaint in physical testing, likely requiring suspension retuning, mass balancing, or structural modification to resolve — all at significant cost.
The mode shape associated with this 42 Hz torsional frequency showed maximum deformation occurring at the rear cross-member to main rail junction — precisely the location where the suspension trailing arms attach and where the greatest dynamic load transfer into the chassis occurs during cornering and road impact events. This spatial coincidence of maximum modal deformation with the primary load input point is the worst possible combination from a fatigue standpoint, and it would not have been visible from any static analysis regardless of how refined the mesh or how carefully applied the loads.
A second important finding was a lateral bending mode at 67 Hz corresponding to the dominant engine firing frequency at normal highway cruise speed for a four-cylinder engine at approximately 4,000 rpm. While the chassis response at this frequency was lower in amplitude than the torsional mode, the coincidence of excitation and natural frequency created a persistent harmonic response that showed up clearly in the subsequent frequency sweep analysis as a secondary amplitude peak at suspension mount locations.
The complete mode shape library extracted from ANSYS modal analysis serves as the interpretive framework for all subsequent analyses. Every harmonic response peak, every random vibration stress concentration, and every fatigue damage accumulation pattern connects back to specific mode shapes that explain the spatial distribution of the problem. Without this foundation, simulation results are numbers without context. With it, every result points directly to a specific physical mechanism and a specific geometric location — giving design engineers the information they need to intervene effectively.
3. Harmonic Response and Random Vibration: Simulating Real-World Excitation

If modal analysis tells you where the chassis is vulnerable, harmonic response and random vibration analysis tell you how severely those vulnerabilities are exploited by the actual loads the vehicle will experience in service.
Harmonic response analysis in ANSYS applies sinusoidal force inputs — derived from engine firing pulses, driveline imbalance, and suspension kinematics — across a swept frequency range and computes the steady-state structural response at every frequency step. The result is a frequency response function: a plot of displacement, velocity, acceleration, or stress amplitude versus frequency at any point of interest in the structure. These curves are the direct evidence of resonance: narrow peaks at the natural frequencies identified in modal analysis, with amplitudes that are governed by the damping ratio and the proximity of the forcing frequency to the natural frequency.
In our chassis study, the harmonic sweep from 0 to 160 Hz revealed a displacement amplitude peak at the rear suspension mount of 3.2 millimetres at 42 Hz under engine excitation representative of 2,500 rpm firing frequency. This 3.4× amplification compared to the quasi-static displacement under the same force magnitude is the direct consequence of operating near resonance, and it translates immediately into stress amplitudes at the mount weld that are 3.4 times larger than static analysis would predict. A designer who sized the weld joint based on static load calculations and applied a conventional safety factor of 1.5 would have been operating with a genuine dynamic safety factor below one — meaning fatigue failure was not a possibility but a certainty.
The harmonic analysis also revealed a secondary resonance at 67 Hz where the lateral bending mode was excited by engine second-order forces. Although the displacement amplitude at this frequency was smaller — approximately 1.8 millimetres at the front subframe attachment — the stress concentration at the front cross-member weld toe reached 215 MPa under this loading condition, exceeding the fatigue endurance limit of the weld material at the predicted load cycle frequency. Two separate resonance-driven failure mechanisms, identified and quantified in a single simulation study.
Random vibration analysis addresses the road roughness input, which cannot be represented as a clean sinusoidal function but instead as a broadband stochastic process characterised by its Power Spectral Density. ISO 8608 provides standardised PSD profiles for different road classes, from smooth motorway surfaces classified as Class A through increasingly rough unpaved roads up to Class E, and these profiles are the direct inputs to the ANSYS random vibration solver.
We applied Class B urban road PSD and Class A highway PSD profiles as base excitation inputs at all four tyre contact points simultaneously, allowing the solver to compute the RMS stress response at every node in the chassis model. The spatial distribution of RMS stress from random vibration analysis closely mirrors the pattern predicted by the dominant mode shapes — confirming that the torsional and lateral bending modes identified in modal analysis are indeed the primary conduits through which road energy enters and amplifies within the chassis structure.
Peak RMS stress under urban road input reached 286 MPa at the rear suspension mounting weld, compared to 198 MPa under highway input — a counter-intuitive result for engineers who assume motorway driving is more demanding than urban driving. The explanation lies in the road PSD shape: urban surfaces have significantly more energy at low frequencies that overlap with the chassis torsional mode at 42 Hz, while motorway surfaces have flatter, lower-amplitude PSDs that excite less resonance amplification despite higher vehicle speeds. This insight directly informs decisions about which road condition governs the fatigue design — a conclusion that cannot be reached without the random vibration analysis.
The combination of harmonic response and random vibration results gives a complete picture of how energy from all significant real-world sources flows into and through the chassis structure, identifying not just the magnitude of stress peaks but their frequency content, their spatial distribution, and their sensitivity to specific natural frequencies that can be targeted for improvement through design modification.
4. Fatigue Life Prediction: From Stress Results to Kilometre Targets
Fatigue analysis is where the vibration simulation results are converted from stress amplitudes into the currency that matters most to design engineers and vehicle manufacturers: predicted service life in kilometres.

The fundamental principle underlying fatigue life prediction is that cyclic stress causes cumulative damage in a material even when the peak stress is well below the static yield strength. Each load cycle consumes a fraction of the material's total fatigue life, and the accumulated damage from millions of cycles eventually initiates a crack at a stress concentration — a weld toe, a notch, a section change — that propagates progressively until fracture. The S-N curve, which relates stress amplitude to the number of cycles to failure for a given material and surface condition, is the primary tool for converting cyclic stress histories into life predictions, and ANSYS Fatigue Module implements this methodology with the full rigour of established standards including BS 7608 for welded steel structures.
In a vibration-driven fatigue assessment, the stress histories are not simple constant-amplitude cycles but complex, variable-amplitude sequences whose statistical properties are defined by the PSD analysis results. The Dirlik method, implemented in ANSYS, converts the response PSD into a probability distribution of stress cycle amplitudes using a semi-empirical formula calibrated against extensive test data, allowing fatigue damage accumulation to be calculated directly from the frequency domain results without requiring time-domain simulation of millions of individual load cycles. This is what makes frequency-domain fatigue assessment computationally feasible for a structure subjected to broadband random loading.
At every node in the chassis model, the Dirlik damage per unit time is computed from the local stress response PSD, scaled by the design loading spectrum representing the intended service duty cycle — the proportion of time spent on different road classes and at different vehicle speeds. Integrating this damage rate over the design life target of 250,000 kilometres immediately identifies every location where the accumulated damage exceeds 1.0 — the threshold beyond which fatigue crack initiation is predicted before the design life is achieved.
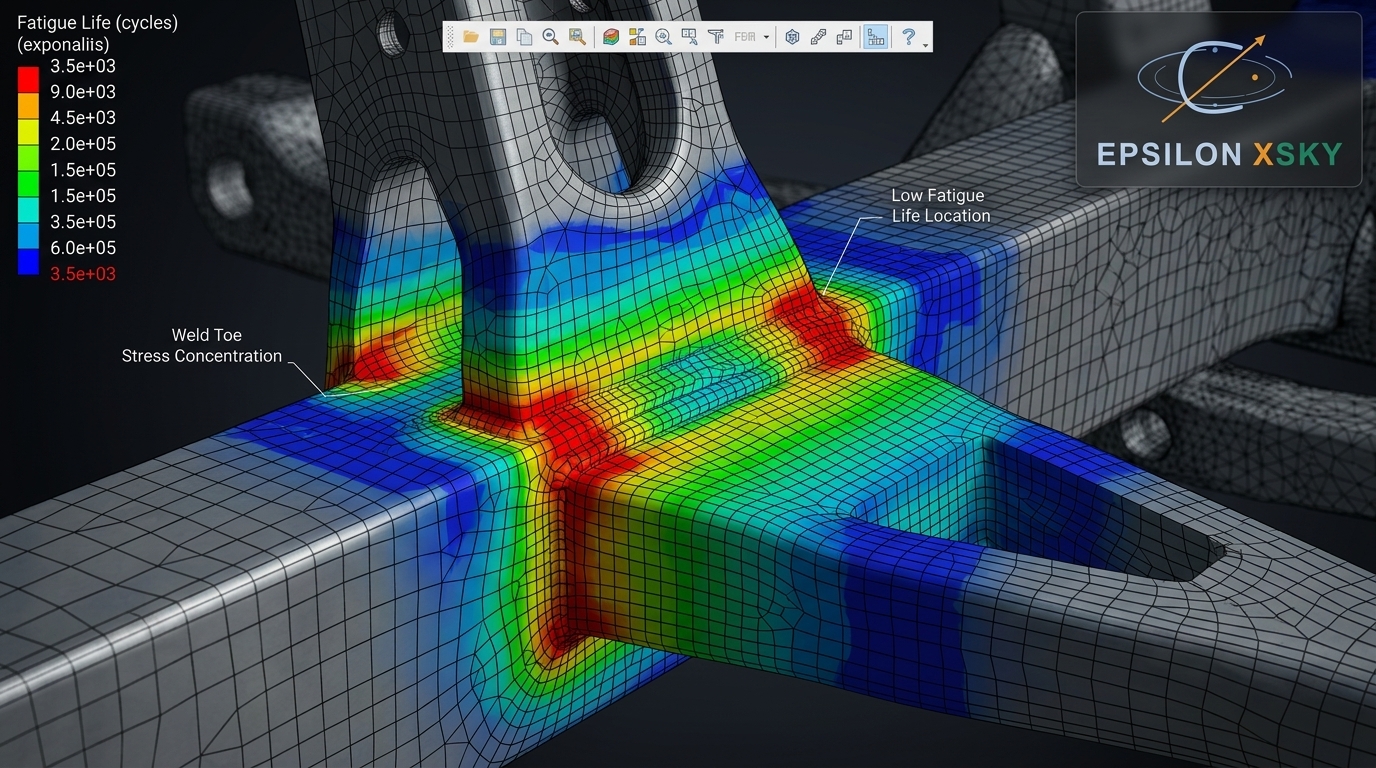
In our study, the initial chassis design produced fatigue damage exceeding 1.0 at two locations: the rear suspension trailing arm mount weld, with a predicted life of 68,000 kilometres against a 250,000 kilometre target, and the front cross-member to main rail junction weld, with a predicted life of 142,000 kilometres. Both failures were driven by the resonance amplification identified in the harmonic and random vibration analyses — confirming that the root cause was dynamic rather than static and that increasing weld size alone would be insufficient without also addressing the underlying resonance conditions.

The design modification strategy followed from the mode shape analysis. Increasing the wall thickness of the rear cross-member from 3.5 mm to 5.0 mm and adding a 40 mm × 40 mm × 4 mm gusset plate at each suspension mount corner increased the local bending stiffness sufficiently to shift the torsional mode frequency from 42 Hz to 51 Hz — moving it above the primary engine excitation range and reducing the harmonic response amplitude at the suspension mount by 62%. The combined effect of stress reduction from gusset reinforcement and amplitude reduction from frequency shift pushed the predicted fatigue life at the previously critical rear mount location to 285,000 kilometres — safely exceeding the design target.
Adding the gusset plates and increasing the cross-member wall thickness added a total mass of 1.18 kilograms to the chassis — less than half a percent of the vehicle kerb weight — demonstrating that targeted, simulation-guided structural modification can dramatically improve fatigue life with negligible mass or cost penalty. This is the outcome that justifies the investment in complete vibration analysis: not a conservative, overdesigned structure that meets life targets by brute force addition of material, but an efficiently modified design that addresses the specific physical mechanisms responsible for premature fatigue failure.
Fatigue contour maps extracted from ANSYS provide a spatially complete picture of damage distribution across the entire chassis, not just at the locations already identified as critical. Reviewing the full contour map after the design modification confirmed that the gusset plates had not introduced new stress concentrations elsewhere in the structure, and that the modified chassis showed a minimum predicted fatigue life of 270,000 kilometres at all locations — a genuinely robust design across its full geometry rather than a locally patched structure with hidden weaknesses elsewhere.
5. Suspension System Analysis and the Path to a Durable, Sustainable Chassis Design

The suspension system is the mechanical interface between the road and the chassis, and its dynamic behaviour is inseparable from the chassis vibration response. Modelling the suspension correctly — its geometry, stiffness, damping, and mass distribution — is essential for producing chassis vibration results that reflect the actual installed condition rather than an idealised free-body approximation.
In ANSYS Mechanical, the suspension system is represented through a combination of structural elements and spring-damper components that capture the essential force-displacement and force-velocity characteristics of the actual hardware. For the double-wishbone front suspension modelled in our study, the upper and lower wishbone arms are represented as shell or beam elements with their actual cross-section geometry and material properties, connected to the chassis through bushing elements that model the rubber mount stiffness and damping in three translational and three rotational degrees of freedom. The coil spring is modelled as a nonlinear spring element with measured stiffness curve data, and the damper as a velocity-dependent force element using the manufacturer's supplied damper characteristic curves.
This level of suspension fidelity is not merely academic. The stiffness and damping properties of the suspension bushings directly control how much vibration energy is transmitted from the wheel to the chassis, and errors in bushing representation translate directly into errors in chassis stress predictions. A bushing that is modelled as too stiff transmits too much vibration energy and over-predicts chassis stress; one modelled as too soft allows excessive suspension deflection and under-predicts the dynamic loads at chassis attachment points. At Epsilon X Sky, we work with physical bushing test data wherever it is available, and apply validated stiffness matrices that capture the coupling between translational and rotational compliance that characterises real rubber components.
The coupling between suspension and chassis dynamics produces behaviour that neither subsystem exhibits in isolation. When the chassis torsional mode at 42 Hz was excited in our model, the suspension geometry responded by producing alternating camber angle variations at the front wheels — a kinematic consequence of the chassis twisting under the suspension attachment points. This camber variation generates lateral tyre forces that in turn feed back into the chassis as additional lateral loading, creating a self-reinforcing excitation loop that contributes to the severity of the resonance. Identifying this feedback mechanism required the coupled suspension-chassis model; a chassis model with fixed suspension attachment points would have missed it entirely.
Sustainability in chassis design has dimensions beyond structural durability, and simulation plays a role in all of them. A chassis that is correctly sized for its dynamic loading — neither overdesigned by conservative static analysis nor underdesigned through neglect of vibration — uses the minimum material necessary to achieve its life target, minimising embodied carbon and manufacturing energy from the outset. The gusset modification in our study added 1.18 kilograms rather than the 8 to 12 kilograms that a conventional overdesign approach would have added through uniform wall thickness increases across multiple members. Over a production run of ten thousand vehicles, that difference represents approximately 70,000 kilograms of steel — a material saving with direct environmental as well as economic significance.
Reducing chassis mass also reduces vehicle kerb weight, which compounds throughout the vehicle's operational life as improved fuel efficiency or extended electric range, delivering sustainability benefits that accumulate over hundreds of millions of kilometres across a vehicle fleet. Simulation-driven lightweight design is therefore not a technical nicety but a direct contributor to the environmental performance of the vehicle across its full life cycle, from raw material extraction through manufacturing, operation, and end-of-life recycling.
The integration of complete vibration analysis into the chassis design process changes the economics of automotive development in ways that go beyond the direct cost of individual design iterations. Physical durability testing on proving grounds typically requires twelve to eighteen months of vehicle operation across multiple road surfaces and climatic conditions, consuming prototypes, driver time, instrumentation, and logistics at costs running into millions of pounds per vehicle programme. CFD-supported simulation studies that predict durability outcomes before physical testing do not eliminate proving ground validation — regulatory requirements and final customer acceptance testing will always require physical evidence — but they dramatically reduce the number of design iterations required at the physical stage by resolving the majority of structural weaknesses in the virtual environment.
At Epsilon X Sky, our complete vibration analysis service encompasses every element described in this article — modal extraction, harmonic sweep, random vibration PSD assessment, fatigue life prediction, suspension coupling, and design modification guidance — delivered as an integrated study with a single coherent report linking every result back to the physical mechanisms and geometric locations that explain it. The chassis that emerges from this process is not just a structure that passes a fatigue target on a spreadsheet. It is a design whose dynamic behaviour has been understood in depth, whose weaknesses have been located and addressed with precision, and whose durability and sustainability credentials rest on a foundation of rigorous mechanical analysis rather than empirical assumption and costly physical iteration.
Simulate it thoroughly. Build it once. Make it last.
Epsilon X Sky — Engineering Design by ANSYS | CFD · FEA · Structural · Thermal
Customized Ingenuity for a Smarter Life
Share this article