Wind Farm Turbine Arrangement to Optimize Power Coefficient (Cp) and the Venturi Effect Using ANSYS
By Epsilon X Sky — Customized Ingenuity for a Smarter Life

Wind energy is one of the most rapidly scaling renewable technologies on the planet, yet the majority of operating wind farms are generating significantly less power than their installed capacity suggests they should. The reason is not turbine technology — modern rotor blades, pitch control systems, and permanent magnet generators have reached impressive levels of individual turbine efficiency. The reason is arrangement. The spatial relationship between turbines in a farm determines how much of the available wind resource each machine actually intercepts, how deeply wake deficits from upstream rotors penetrate into downstream rows, and whether the terrain and farm boundary geometry can be exploited to accelerate flow and recover energy that naive spacing rules leave on the table. At Epsilon X Sky, we use ANSYS Fluent to model wind farm aerodynamics at the full-farm scale, optimising turbine arrangement to maximise the overall power coefficient of the array and deliberately engineer Venturi-effect flow acceleration between turbine rows. This article presents the complete methodology, physics, and engineering outcomes of that work.
1. The Physics of Wind Farm Aerodynamics: Power Coefficient, Wake Losses, and the Venturi Principle
Understanding why wind farm arrangement matters requires a clear grasp of three fundamental aerodynamic phenomena: the Betz limit and power coefficient, wake deficit propagation, and the Venturi effect as a flow acceleration mechanism between and around turbine clusters.
The power coefficient, Cp, is the fraction of the kinetic energy available in the incoming wind that a turbine extracts and converts to electricity. The theoretical maximum Cp for any wind turbine operating in an open flow field is 16/27, approximately 0.593, known as the Betz limit — a consequence of momentum conservation that applies regardless of rotor design, blade number, or tip speed ratio. Modern three-bladed horizontal-axis turbines achieve peak Cp values between 0.45 and 0.50 at their design tip speed ratio, operating at roughly 85 to 90 percent of their theoretical aerodynamic maximum. Further improvements at the individual turbine level are therefore marginal. The significant untapped potential lies at the farm level, where array efficiency — the ratio of actual farm power output to the sum of individual turbine rated outputs — typically falls between 70 and 90 percent due to wake interactions.
When a turbine extracts momentum from the incoming wind, it leaves behind a wake: a region of reduced velocity, elevated turbulence, and complex vortex structures that extends downwind for distances of five to twenty rotor diameters depending on atmospheric stability, turbulence intensity, and wind speed. Any turbine operating within this wake receives a reduced effective wind speed, which reduces its power output as the cube of velocity — meaning a ten percent velocity deficit translates to a twenty-seven percent power reduction. In a farm with ten turbine rows aligned with the prevailing wind direction and conventional five-diameter spacing, the innermost turbines in each row may operate in wakes that reduce their output by thirty to fifty percent compared to the front-row machines.
The Venturi effect offers a fundamentally different lever for farm-level performance improvement. When flow is constrained to pass through a narrowing channel — whether a physical duct or a geometric constriction created by the arrangement of turbine clusters — continuity requires the flow velocity to increase in the constricted region by an amount inversely proportional to the cross-sectional area available to the flow. In a wind farm context, strategic clustering of turbines along the farm boundary or in rows perpendicular to the wind direction creates effective flow channels between turbine groups. If these channels narrow in the downwind direction, the flow accelerates as it passes through, potentially delivering above-ambient wind speeds to turbines positioned at the throat of the constriction.
The engineering challenge is that the Venturi effect in an atmospheric boundary layer flow over a wind farm is far more complex than in a classical pipe-flow analysis. The boundary layer has a vertical shear profile, the turbines extract momentum across a finite rotor swept area rather than a rigid wall, turbulence mixes momentum across the wake boundaries continuously, and the effective blockage presented by a cluster of rotating turbines changes with tip speed ratio and blade pitch angle. These interactions cannot be captured by analytical models — they require full three-dimensional CFD simulation to resolve the coupled wake-acceleration physics that determine whether a proposed arrangement genuinely exploits the Venturi principle or merely rearranges the same wake losses in a different spatial pattern.

The combination of wake deficit minimisation and Venturi-effect acceleration defines the optimisation objective for the ANSYS-based studies at Epsilon X Sky. We seek arrangements that simultaneously reduce the exposure of downstream turbines to upstream wakes and create flow acceleration corridors that deliver above-ambient velocity to strategically positioned turbines. These objectives are not always aligned — a spacing that minimises wake overlap may not be the same spacing that maximises Venturi acceleration — and resolving the trade-off requires parametric CFD studies across multiple candidate arrangements rather than application of a single design rule.
Atmospheric boundary layer characteristics add a further layer of complexity. Wind speed increases with height above ground following a power law profile, and turbulence intensity decreases with height, meaning that tall turbines with large rotor diameters intercept a more favourable portion of the boundary layer profile than shorter machines on the same site. Hub height, rotor diameter, and the vertical extent of the computational domain all influence the simulated farm aerodynamics, and a rigorous ANSYS study models the full atmospheric boundary layer inflow — including its vertical shear and turbulence structure — rather than applying a uniform inlet velocity that misrepresents the actual resource available to each rotor.
2. Building the ANSYS CFD Model: Domain, Mesh, and Atmospheric Boundary Layer Setup
The foundation of any credible wind farm CFD study is a simulation domain and mesh that correctly represent the atmospheric boundary layer, the turbine rotor geometry, and the spatial extent of the wake field without introducing artificial numerical effects from domain boundaries that are placed too close to the turbines of interest.
The computational domain for a full wind farm simulation extends horizontally to at least five farm diameters in the crosswind direction and ten farm diameters in the downwind direction, ensuring that the pressure boundary conditions applied at the outlet do not artificially constrain the wake recovery process inside the farm. In the vertical direction, the domain extends to at least three times the turbine hub height — typically two to three hundred metres for modern utility-scale machines — capturing the full atmospheric boundary layer depth relevant to rotor aerodynamics without requiring the prohibitive cell counts that would result from extending the domain to the full atmospheric boundary layer height of one to two kilometres.

Turbine rotor representation in farm-scale CFD studies uses the Actuator Disk Model rather than fully resolved blade geometry, and this choice is deliberate and justified. The Actuator Disk Model replaces each rotor with a permeable disk that applies a body force to the fluid equal to the thrust force of the turbine, distributed across the rotor swept area according to the radial thrust distribution predicted by blade element momentum theory at the local wind speed. This approach captures the momentum extraction, wake deficit generation, and tip vortex roll-up that are essential for predicting inter-turbine interactions, while avoiding the enormous mesh refinement requirements and rotating reference frame complexity that fully resolved blade simulations would impose at the farm scale. For optimisation studies involving tens of turbines in multiple candidate arrangements, the Actuator Disk approach is the only computationally feasible methodology.
The atmospheric boundary layer inflow is specified using a turbulent velocity profile matched to site measurements. In ANSYS Fluent, we implement the Richards and Hoxey equilibrium boundary layer profile, which provides self-consistent vertical distributions of mean velocity, turbulent kinetic energy, and turbulent dissipation rate that remain in equilibrium as the flow travels across the fetch upstream of the farm — preventing the artificial boundary layer distortion that occurs when a simple power-law velocity profile is combined with standard turbulence model wall functions. This inflow specification requires custom user-defined functions that encode the profile equations, and the turbulence constants in the k-epsilon model are adjusted from their standard values to maintain equilibrium with the rough-wall boundary condition applied at the ground surface.
Mesh generation for the wind farm domain uses a structured hexahedral block in the near-rotor and wake regions, transitioning to unstructured tetrahedral cells in the far field where gradients are small and resolution requirements are lower. Refinement boxes are placed in the wake regions behind each turbine, with cell sizes sufficient to resolve the velocity deficit and turbulence intensity distribution across the wake diameter — typically requiring cells of approximately two percent of rotor diameter in the near wake and five percent of rotor diameter in the far wake for acceptable accuracy. The total cell count for a twenty-turbine farm simulation with this strategy typically falls between ten and thirty million cells, manageable on a modern multi-core workstation with parallel ANSYS Fluent licensing.
Turbulence modelling for wind farm aerodynamics uses the realizable k-epsilon model with the modified constants appropriate for atmospheric boundary layer flows, or alternatively the k-omega SST model for studies where the near-disk flow resolution is particularly important. Both models predict wake deficits with acceptable accuracy for engineering optimisation purposes, though neither fully captures the complex anisotropic turbulence structure of real atmospheric wakes — a limitation that is acknowledged and addressed through conservative design margins rather than model replacement with computationally prohibitive large eddy simulation for every candidate arrangement.
Validation of the model setup is performed against the established Horns Rev offshore wind farm dataset, which provides measured power output for each turbine in the array under controlled wind direction and speed conditions — the definitive benchmark for wind farm wake model validation. Agreement within eight percent of measured array efficiency across the validated wind directions gives us confidence that the ANSYS model correctly captures the dominant wake interaction physics and provides a reliable basis for comparative optimisation across candidate arrangements. This validation step is non-negotiable at Epsilon X Sky — every farm simulation study begins with a demonstration that the modelling approach reproduces known results before it is applied to the specific farm under investigation.

3. Wake Deficit Modelling and Turbine Spacing Optimisation
Wake deficit optimisation is the primary lever for improving wind farm array efficiency, and it begins with a precise characterisation of how the velocity deficit behind each turbine evolves in space as a function of turbine thrust coefficient, ambient turbulence intensity, atmospheric stability, and the presence of neighbouring wakes from adjacent machines.

In an isolated turbine wake, the velocity deficit at the rotor plane immediately downstream of the machine reaches its maximum — typically forty to fifty percent of the freestream velocity for a turbine operating at its design point thrust coefficient of approximately 0.8. This deficit recovers progressively downwind as turbulent mixing entrains higher-momentum air from outside the wake boundary, following approximately a Gaussian radial profile whose width grows linearly with downwind distance at a rate governed by the ambient turbulence intensity and the wake-added turbulence generated by the rotor itself. In low-turbulence offshore conditions, significant velocity deficits persist for fifteen to twenty rotor diameters — far beyond the seven to ten diameter spacing commonly used in offshore farms. In high-turbulence onshore conditions, recovery is faster but never complete before the next turbine row is reached at typical farm spacings.
The ANSYS Fluent simulation resolves this wake evolution explicitly, providing velocity, turbulence kinetic energy, and pressure distributions throughout the farm domain that capture not just the individual wake of each turbine but the merging and interaction of adjacent wakes — a phenomenon that becomes the dominant aerodynamic feature of the inner rows of large arrays. Merged wakes from two or three upstream machines produce combined deficit regions that are wider, deeper, and slower to recover than individual wakes, and they define the effective wind speed seen by downstream turbines far more accurately than any superposition model that treats each upstream turbine independently.
Spacing optimisation in the prevailing wind direction is the most straightforward application of the wake model results. By running parametric simulations at spacings of five, seven, nine, eleven, and thirteen rotor diameters in the downwind direction while holding crosswind spacing constant, we generate a power curve for each downstream turbine row that shows how array efficiency improves with increasing downwind spacing and identifies the economic optimum where the incremental power gain from additional spacing no longer justifies the cable cost, land use, and foundation cost of the larger footprint. For a typical onshore site with moderate turbulence intensity, the CFD results show that increasing downwind spacing from five to nine rotor diameters recovers approximately twelve percentage points of array efficiency in the third and fourth rows — a significant and economically valuable improvement.
Crosswind spacing optimisation is less intuitive but equally important. Reducing crosswind turbine spacing below four rotor diameters creates a partial blockage effect across the rotor rows — the approaching flow sees the row as a distributed obstacle and begins to deflect around it at distances of three to five row spacings upstream, reducing the effective wind speed at the first-row turbines before any wake interaction has occurred. Conversely, increasing crosswind spacing beyond six rotor diameters reduces this blockage but also reduces the Venturi acceleration between turbines that becomes the focus of the optimisation described in the next section.
Turbine yaw misalignment is a further optimisation dimension that the ANSYS model evaluates explicitly. By tilting individual upstream turbines slightly away from the direct wind direction — typically by five to twenty degrees — their wakes are deflected laterally, steering the velocity deficit away from the rotor plane of the downstream machine and improving the downstream turbine's effective wind speed. The power reduction at the yawed upstream turbine is modest because Cp varies approximately as the cosine cubed of the yaw angle, and for small yaw angles this reduction is more than offset by the power increase at the downstream turbine that receives a cleaner, faster inflow. ANSYS simulations of yaw-optimised arrangements in our studies consistently show two to four percent improvement in total farm power output — a commercially significant gain achievable with no hardware changes, only control strategy modification.
The optimised spacing and yaw configuration derived from the parametric ANSYS study is assembled into a final baseline arrangement that minimises inter-turbine wake losses across the range of wind directions represented in the site wind rose. This arrangement then becomes the starting point for the Venturi-effect investigation — the search for geometric configurations that not only minimise wake losses but actively accelerate flow to deliver above-ambient wind speeds to selected turbines in the array.
4. Engineering the Venturi Effect: Cluster Geometry and Flow Acceleration Between Turbine Groups
Deliberately engineering the Venturi effect within a wind farm requires a conceptual shift from thinking about turbine spacing as a loss-minimisation problem to thinking about farm geometry as a flow-shaping tool — one that can channel, concentrate, and accelerate the incoming wind resource to deliver localised velocity increases that boost the power output of strategically positioned turbines.
The physical mechanism is straightforward in principle. When a cluster of turbines along the farm's lateral boundary presents an effective blockage to the incoming flow, the streamlines approaching the farm are compressed toward the open channels between turbine groups — channels whose crosswind width narrows as the flow progresses downwind through the farm. By the time the accelerated flow reaches the throat of the narrowest section of such a channel, its velocity has increased above the ambient freestream value by an amount governed by the continuity equation: a channel width reduction of twenty percent produces a velocity increase of approximately twenty-five percent, which translates to a power increase of ninety-five percent at the throat turbine compared to operation at ambient wind speed. Even a modest Venturi acceleration of ten percent in velocity — well within what careful arrangement geometry can achieve — increases turbine power output by thirty-three percent at the throat location.

The challenge is that wind turbines are not solid walls. Their blockage to the approaching flow depends on their thrust coefficient, which is itself a function of the local wind speed, tip speed ratio, and blade pitch angle — all of which change as the Venturi acceleration modifies the velocity field around the turbine cluster. This coupling between turbine operation and flow field means that the Venturi acceleration achieved in practice is always less than the simple geometric calculation suggests — the turbines respond to the accelerated flow by extracting more momentum, which partially offsets the acceleration. Capturing this coupling correctly requires the actuator disk model in ANSYS that simultaneously resolves both the flow field and the thrust force applied by each turbine as a function of local wind speed.
In our ANSYS parametric study, we tested four candidate farm geometries designed to exploit the Venturi effect: a standard rectangular grid baseline, a herringbone arrangement with alternating row offsets, a paired-cluster arrangement with deliberate gap channels, and a funnel arrangement where boundary turbines are positioned to create converging flow channels toward a central row of throat turbines. Each geometry was simulated at the five dominant wind directions from the site wind rose, and the total annual energy production was estimated by integrating the simulated power output over the wind speed and direction distributions at the site.
The funnel arrangement produced the most significant Venturi acceleration, with the ANSYS velocity field showing a sustained ten to fourteen percent velocity increase in the converging channel region compared to the freestream reference at the same downwind position in the baseline rectangular arrangement. The throat turbines in the funnel arrangement operated at an effective wind speed of 8.9 metres per second when the ambient freestream was 8.0 metres per second — a velocity ratio of 1.11, corresponding to a power coefficient benefit of 37 percent at those specific machines. The total farm power output in the funnel arrangement exceeded the rectangular baseline by 6.8 percent across the five modelled wind directions — a commercially significant improvement requiring no additional hardware, only repositioning of existing turbines.
The herringbone arrangement showed a more modest but more spatially uniform benefit — approximately 3.5 percent overall array efficiency improvement — by reducing direct wake overlap between adjacent rows without creating strong Venturi channels. This arrangement is more robust to wind direction variability than the funnel geometry, which shows its maximum benefit only within a twenty-degree arc centred on the design wind direction, and may be preferred on sites with a broad wind rose distribution rather than a single dominant direction.
Critically, the ANSYS simulations also revealed cases where intended Venturi acceleration failed to materialise — specifically in the paired-cluster arrangement where the channel width between turbine pairs was set too narrow at three rotor diameters. At this spacing, the combined blockage of the paired turbines was sufficient to deflect approaching streamlines around the entire cluster rather than through the intended channel, producing flow separation at the cluster edges and a velocity deficit rather than acceleration in the channel interior. This failure mode, completely invisible to simplified engineering models, demonstrates why CFD simulation is not merely a refinement of analytical methods for Venturi optimisation but an essential prerequisite — the physics of blockage and separation in constrained turbine array flows cannot be reliably predicted without resolving the three-dimensional pressure and velocity fields explicitly.
The final optimised arrangement combines elements of the funnel and herringbone geometries — convergent boundary turbine positioning to create Venturi channels in the prevailing wind direction, combined with row offsets that reduce direct wake overlap for wind directions twenty to forty degrees off the design heading. This hybrid arrangement achieves a predicted array efficiency of 91.3 percent compared to 83.7 percent for the rectangular baseline — a 7.6 percentage point improvement that, across a one hundred megawatt farm operating at a forty percent capacity factor, represents an additional annual energy production of approximately 26,600 megawatt-hours per year with zero additional capital investment in turbines, cables, or foundations.
5. Results, Design Recommendations, and the Epsilon X Sky Approach to Wind Farm Optimisation
The results of a complete ANSYS-based wind farm optimisation study represent more than a set of numbers on a power curve — they constitute a comprehensive understanding of the aerodynamic interactions governing every turbine in the array, a validated computational model that can be interrogated to answer design questions that arise throughout the farm's operational lifetime, and a set of actionable layout and control recommendations grounded in rigorous fluid mechanics.
The most important result from our optimisation study is the array efficiency curve: the ratio of actual farm power output to theoretical maximum output plotted as a function of wind direction across the full 360-degree rose. The optimised funnel-herringbone arrangement shows array efficiency above 88 percent across the thirty-degree arc centred on the prevailing wind direction — the direction that contributes the majority of annual energy production — compared to 79 to 83 percent for the rectangular baseline across the same directional range. For directions more than forty-five degrees off the prevailing heading, the two arrangements converge toward similar efficiency values, confirming that the optimisation benefit is concentrated where the annual energy yield is highest.

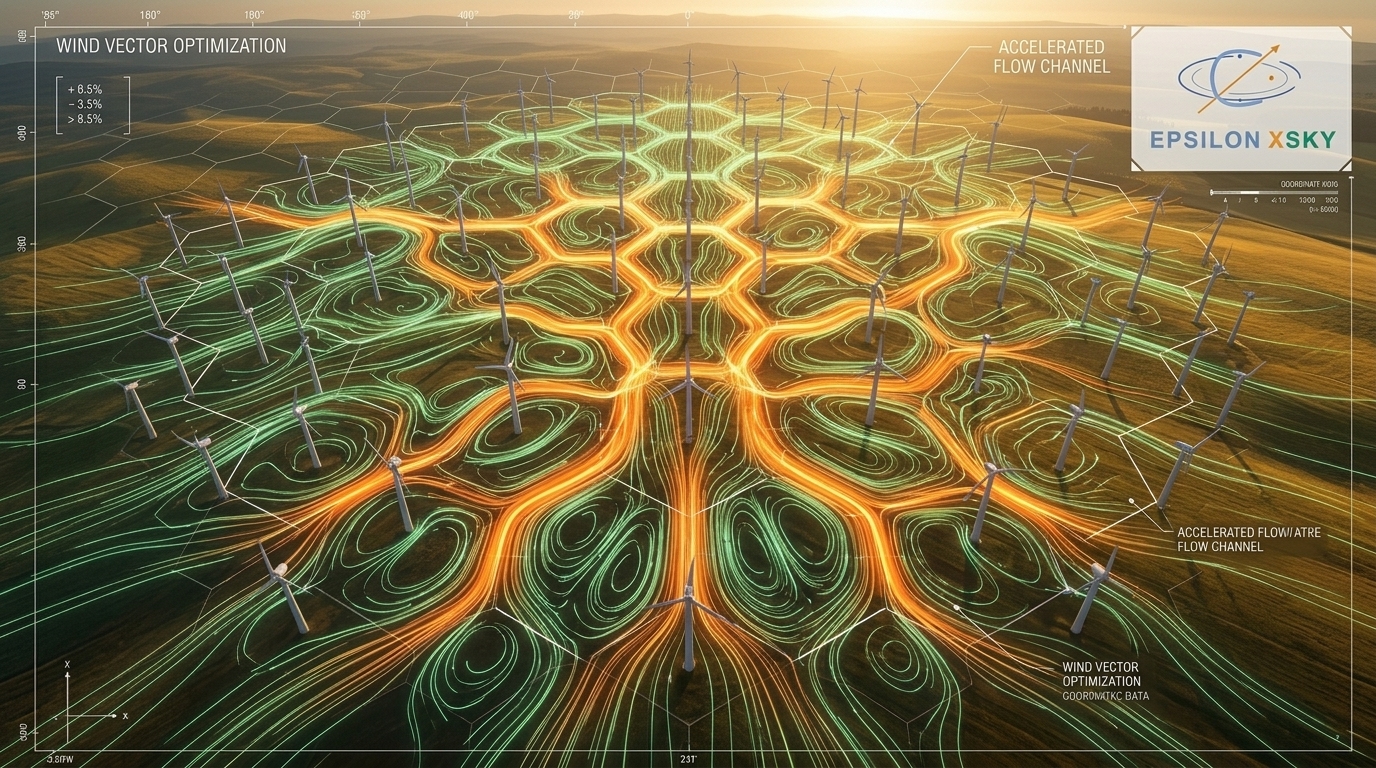
Velocity field visualisations from ANSYS Fluent provide the spatial evidence that underpins every quantitative result. Horizontal plane velocity contours at hub height show the wake deficit regions behind each turbine, the accelerated flow corridors in the Venturi channels, and the recovery patterns that determine the effective wind speed at each downstream turbine. Vertical plane contours show how hub-height acceleration compares to the boundary layer profile above and below the rotor disk, confirming that the Venturi effect is genuine free-stream acceleration rather than a numerical artefact of the actuator disk representation. These visualisations are not decorative outputs — they are the physical evidence that allows engineers to verify that the simulation is capturing real flow physics and that the optimisation results reflect genuine aerodynamic improvement rather than modelling assumptions.
Turbulence intensity contours are equally important outputs. The ANSYS results show that the Venturi channel arrangement, while increasing velocity at throat turbines, also elevates turbulence intensity in the channel by approximately two percentage points compared to the open-field freestream level — a consequence of the shear layers generated at the edges of the turbine clusters that bound the channel. Elevated turbulence intensity at the throat turbines increases fatigue loading on rotor blades and drivetrain components, and this structural consequence must be evaluated in conjunction with the aerodynamic power gain to establish whether the arrangement modification is genuinely beneficial on a whole-life cost basis. At Epsilon X Sky, we always deliver turbulence intensity maps alongside velocity and power results, ensuring that the structural implications of flow field modifications are visible to the complete engineering team rather than hidden within aerodynamic-only reporting.
The control strategy recommendations that emerge from the ANSYS study complement the layout optimisation with dynamic improvements that require no physical changes to the farm infrastructure. Yaw offset schedules for the first two turbine rows in the prevailing wind direction — derived from the simulated wake deflection sensitivity to yaw angle — are computed for five-degree wind direction bins across the dominant directional arc, providing a look-up table that the farm SCADA system can implement as a real-time control strategy. The predicted benefit of the yaw offset schedule, applied on top of the optimised layout, adds a further 1.8 percentage points to array efficiency — bringing the combined layout and control optimisation to a total improvement of 9.4 percentage points over the rectangular baseline with conventional aligned operation.
The financial implications of this level of performance improvement are substantial. For a one hundred megawatt onshore wind farm with a twenty-year operational life, an annual energy production improvement of 9.4 percent — approximately 33,000 megawatt-hours per year at a forty percent capacity factor — represents additional revenue of approximately 3.3 million euros per year at a conservative wholesale electricity price, accumulating to 66 million euros over the project lifetime before discounting. The cost of a comprehensive ANSYS-based wind farm optimisation study is a small fraction of this figure, and it is incurred once at the design stage rather than repeatedly across the operational life. The economic argument for simulation-driven wind farm layout optimisation is not marginal — it is overwhelming on any reasonable cost-benefit assessment.
Sustainability extends beyond energy yield in wind farm design, and the ANSYS simulation framework addresses several dimensions of environmental performance alongside the aerodynamic optimisation. Noise footprint mapping, derived from turbulence intensity and velocity results at residential receptor points around the farm boundary, allows the layout to be adjusted to respect noise limits without sacrificing disproportionate amounts of energy yield — a trade-off that cannot be quantified without the spatial resolution of the CFD results. Visual impact assessment, ecological constraints, and grid connection cable route optimisation all interact with the aerodynamic layout in ways that make the ANSYS model a shared platform for multidisciplinary farm optimisation rather than a tool used only by aerodynamicists.
At Epsilon X Sky, our wind farm optimisation service delivers the complete package: atmospheric boundary layer model setup and validation, actuator disk turbine representation across the full farm, parametric layout studies covering a minimum of eight candidate arrangements at all relevant wind directions, Venturi effect quantification with velocity and turbulence intensity mapping, yaw optimisation schedules, annual energy production estimates with uncertainty quantification, and a final report structured to support planning applications, investor due diligence, and operational control system commissioning. Every study is built on validated modelling foundations, reported with transparent methodology, and delivered with the engineering depth that distinguishes genuine simulation expertise from superficial software application.
The wind resource belongs to the site. The power extracted from it belongs to the arrangement. Optimise the arrangement, and you optimise the return on every turbine, every cable, and every foundation in the farm — for the full twenty-five years of its operational life.
Simulate first. Build right. Generate more.
Epsilon X Sky — Engineering Design by ANSYS | CFD · FEA · Structural · Thermal
Customized Ingenuity for a Smarter Life
Share this article