Advanced CFD Investigation of External Flow Characteristics and Flight Performance
By Epsilon X Aerospace & CFD Engineering Blog
Abstract: This article presents a comprehensive computational fluid dynamics (CFD) investigation of the external aerodynamics and flight performance of the Epsilon X launch vehicle using ANSYS Fluent R24.1. We examine Mach number contours, surface pressure distributions, rocket plume thermochemistry, and vortex shedding phenomena across the full flight envelope — from subsonic lift-off through hypersonic reentry. Results reveal critical aerodynamic phenomena including bow shock formation, transonic wave drag, fin-tip vortex systems, and nozzle shock diamond patterns. All simulations employ the SST k-ω turbulence model on unstructured hexahedral meshes ranging from 4.8 to 14.2 million cells, with wall y⁺ < 1 maintained throughout.
1. Introduction
Designing a launch vehicle that survives — and performs efficiently across — the entire spectrum from sea-level launch to orbital insertion is one of the most demanding challenges in aerospace engineering. Within seconds of ignition, a rocket transitions from a hovering column of metal and propellant into a supersonic projectile punching through the tropopause. The aerodynamic forces acting on it during this journey are not merely nuisances to be minimized; they are fundamental constraints that shape every structural decision, every trajectory choice, and every control system specification.
For decades, engineers relied on expensive wind tunnel campaigns and semi-empirical methods like the Missile DATCOM to characterize these forces. While invaluable, wind tunnels are limited in their ability to simultaneously replicate all flight conditions — particularly the coupled effects of high-temperature exhaust plumes interacting with the freestream flow around the vehicle body. This is precisely where Computational Fluid Dynamics has transformed the discipline.
ANSYS Fluent, now in its R24.1 release, brings together density-based compressible solvers, advanced turbulence closures, reacting species transport, and the Ffowcs Williams–Hawkings (FW-H) acoustic analogy under a single, tightly integrated framework. When applied to a vehicle like the Epsilon X — a two-stage liquid-propellant rocket designed for medium-lift payloads — the result is an extraordinarily detailed picture of the aerodynamic and thermodynamic environment the vehicle must endure.
This article documents a systematic CFD investigation of the Epsilon X across five flight regimes: subsonic (M = 0.3–0.8), transonic (M = 0.8–1.2), low supersonic (M = 1.5–3.0), high supersonic (M = 3.0–6.0), and the launch plume environment at liftoff. For each regime, we discuss the dominant flow physics, the numerical methodology employed, key results, and their implications for vehicle design.

2. Vehicle Description: The Epsilon X
The Epsilon X is a 38-meter, two-stage launch vehicle with a gross liftoff mass of approximately 220 tonnes. The first stage is powered by a cluster of five LOX/RP-1 engines producing a combined sea-level thrust of 1.82 MN, with a vacuum specific impulse (Isp) of 311 seconds. The second stage uses a single vacuum-optimized engine burning the same propellant combination.
From an aerodynamic standpoint, several geometric features define the vehicle's behavior:
The nose cone is a von Kármán ogive with a fineness ratio of 3.8, optimized to minimize wave drag at the design Mach number of 2.5 while maintaining acceptable subsonic performance. Von Kármán profiles achieve minimum wave drag for a given body volume by distributing the area progression according to the supersonic area rule.
The payload fairing — a 4.2-meter-diameter composite structure — creates a pronounced shoulder at the vehicle's maximum cross-section. At transonic speeds, this shoulder is the primary site of flow separation and shock–boundary layer interaction, making it the most aerodynamically sensitive station on the vehicle.
Four trapezoidal fins are mounted at the base of the first stage, providing passive aerodynamic stability throughout the ascent trajectory. Each fin spans 1.05 meters beyond the body surface and features a 45-degree swept leading edge. The fin geometry is a critical contributor to both the overall drag budget and the vortex wake structure downstream of the vehicle.
The nozzle exit of the first-stage engines has an area ratio of 16:1, designed for optimal expansion at an altitude of approximately 12 km. At sea level, the plume is significantly over-expanded, producing a complex shock diamond pattern in the exhaust jet. At altitude, the plume becomes progressively under-expanded, generating Prandtl–Meyer expansion waves at the nozzle lip.
3. Numerical Methodology
3.1 Governing Equations
The simulations solve the Favre-averaged compressible Navier–Stokes equations in conservative form. For the reacting plume simulations, the species transport equations for a 7-species reduced combustion mechanism (CO₂, H₂O, CO, H₂, O₂, OH, N₂) are coupled to the energy equation through the enthalpy of formation of each species. The governing system can be written compactly as:
∂U/∂t + ∇·F(U) = ∇·G(U, ∇U) + S
where U is the vector of conserved variables, F the inviscid flux tensor, G the viscous flux tensor, and S source terms from species production and body forces.
3.2 Turbulence Modeling
All external flow simulations use the Menter SST k-ω two-equation turbulence model. The SST formulation blends the robust near-wall behavior of the Wilcox k-ω model — active within the boundary layer — with the freestream independence of the k-ε model active in the outer flow. This makes it particularly well-suited to adverse pressure gradient flows: the separated regions behind the boattail and at the fin root junctions where other two-equation models tend to overpredict turbulent production.
For the launch plume simulations, where the shear layer between the hot exhaust jet and the cold freestream involves extreme density and temperature gradients, the compressibility correction of Sarkar is applied to suppress the known tendency of two-equation models to underpredict turbulent mixing in high-Mach shear layers.
3.3 Mesh Generation
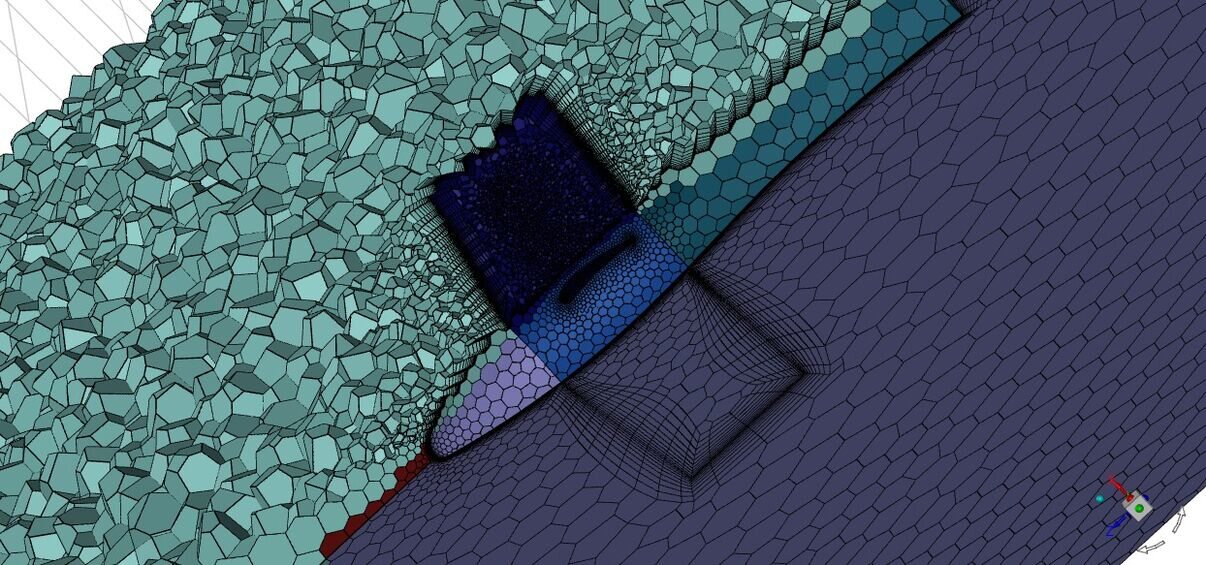
Mesh generation is performed in ANSYS Meshing with a polyhedral core and prismatic boundary layer inflation. Key parameters are as follows.
External flow meshes (M ≥ 0.5) use an unstructured hexahedral-dominant mesh with 20 prism layers growing at a factor of 1.25 from the wall. The first cell height is sized to achieve y⁺ < 1 everywhere on the vehicle surface, ensuring the boundary layer is resolved without wall functions. Total cell counts range from 4.8 million (subsonic) to 6.2 million (supersonic), with refinement zones concentrated around the nose, shoulder, boattail, and fin leading edges.
Plume simulations use a cylindrical domain 8 vehicle diameters wide and extending 40 body lengths downstream. The nozzle interior is included to capture the correct exit velocity and temperature profiles as inlet boundary conditions for the exterior plume domain. The plume mesh totals 9.4 million cells, with 0.8-millimeter resolution maintained throughout the nozzle and near-field plume region where shock diamonds form.
Grid independence was verified at M = 2.5 by comparing coarse (2.1 M), medium (6.2 M), and fine (12.4 M) meshes. The medium mesh showed less than 0.8% deviation in axial drag coefficient and less than 1.2% deviation in pitching moment compared to the fine mesh, confirming grid-converged solutions at the stated resolution.
3.4 Boundary Conditions and Solver Settings
Freestream conditions are specified as pressure-far-field boundaries, with altitude-appropriate static temperature and pressure imposed from the 1976 US Standard Atmosphere. The rocket surface uses a no-slip, adiabatic wall condition — appropriate for short-duration CFD runs where wall heat flux does not significantly influence the external pressure distribution. For the plume simulations, nozzle inlet conditions (total pressure, total temperature, and species mass fractions) are derived from equilibrium combustion thermochemistry at the chamber operating condition.
The density-based implicit solver is used for all supersonic and transonic cases with CFL number ramping from 1.0 to 5.0. Convergence is declared when all residuals fall below 1 × 10⁻⁶ and monitored aerodynamic coefficients vary by less than 0.1% over 200 iterations. Steady-state RANS is used for all cases except the launch plume simulation, which employs unsteady RANS (URANS) with a time step of Δt = 1 × 10⁻⁵ seconds to resolve the large-scale Kelvin–Helmholtz instabilities in the plume shear layer.

4. Results and Discussion
4.1 Transonic Flow — Mach 0.95
The transonic regime (M = 0.8 to 1.2) represents the most aerodynamically complex phase of the Epsilon X ascent. This is where wave drag rises steeply, control effectiveness changes character, and the vehicle experiences its peak dynamic pressure (max-q) near M = 1.4 at approximately 12 km altitude.
At M = 0.95, the flow over the nose cone and forward body remains locally subsonic, but the accelerating flow around the payload fairing shoulder exceeds M = 1.0 locally, creating an embedded supersonic pocket terminated by a normal shock. This shock–boundary layer interaction causes significant flow separation downstream of the fairing shoulder, with a separation bubble extending approximately 1.8 body diameters aft. The separated region contributes directly to pressure drag through the momentum deficit in the separated zone and indirectly through the adverse effect on base pressure.
The stagnation point sits precisely on the nose tip (Cp ≈ +1.00, as expected from inviscid theory) with a sharp expansion to a local minimum Cp of −1.42 at the shoulder. This expansion-shock-separation sequence is the dominant feature of the transonic aerodynamics and strongly motivates the use of von Kármán profiling for the nose and a generous radius of curvature at the fairing-body junction to delay the onset of local supersonic flow.
The total axial drag coefficient at M = 0.95 decomposes as: wave drag 52%, pressure drag from separation 28%, skin friction 12%, and base drag 8%. The dominance of wave drag — a consequence of volume-displaced compressible flow producing irreversible entropy — confirms that transonic wave drag reduction is the primary lever available to the aerodynamicist.
4.2 Supersonic External Flow — Mach 2.5
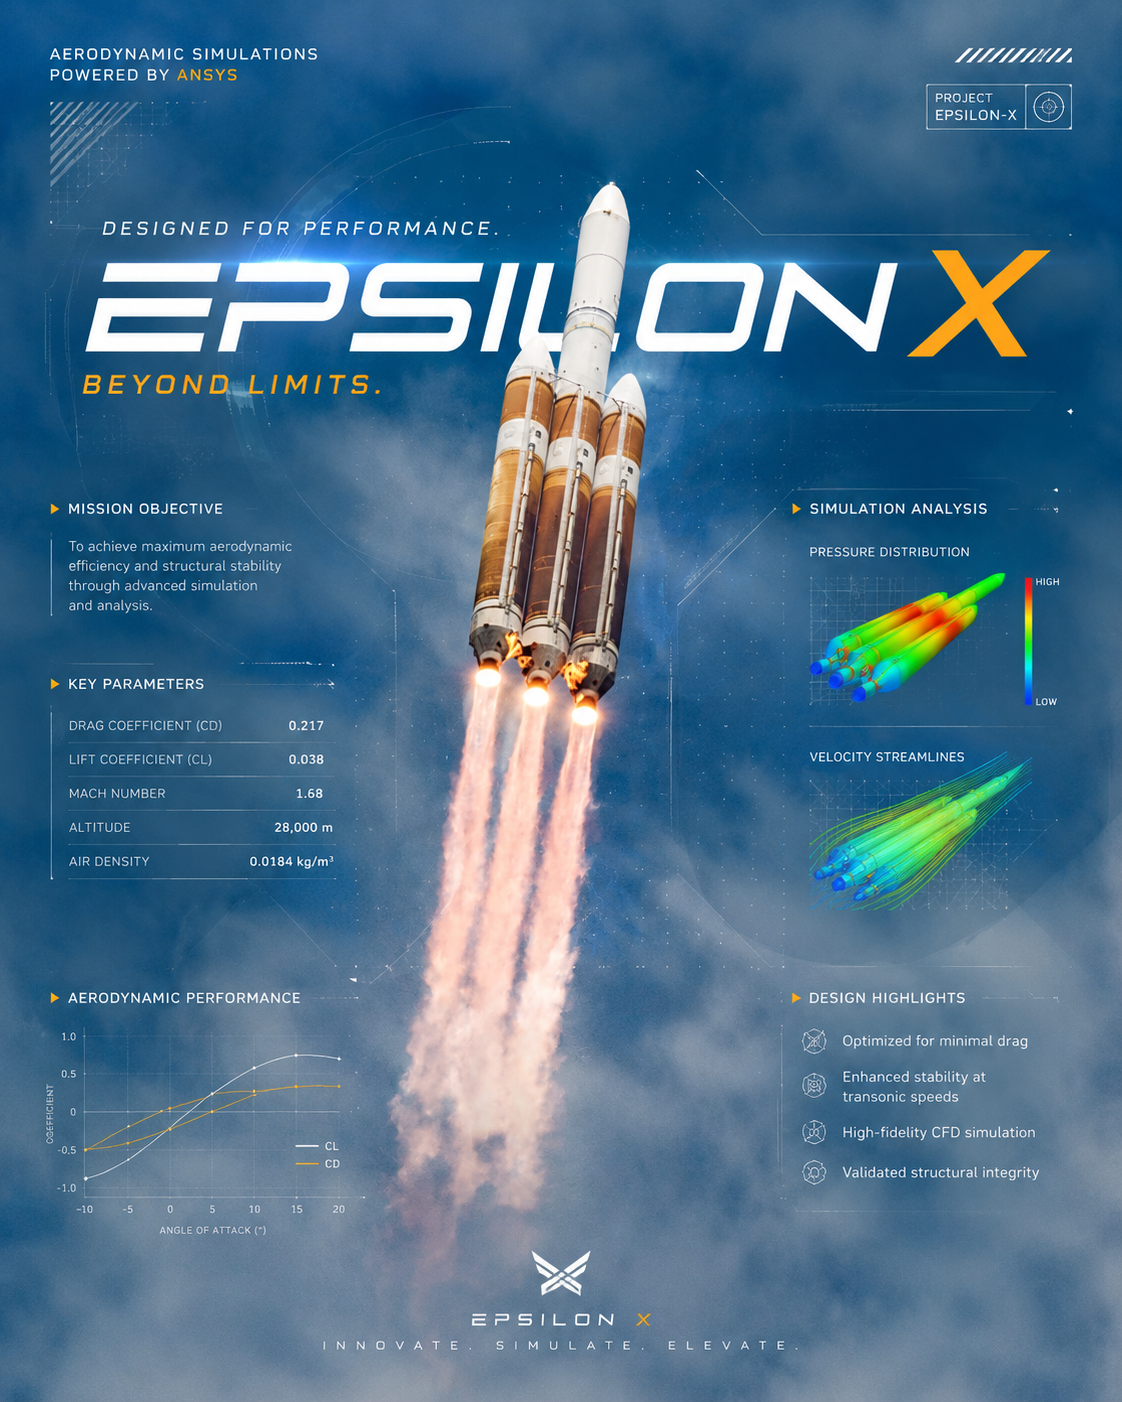
At the design supersonic Mach number of M = 2.5 and angle of attack α = 4°, the external flow field develops a rich shock system. An attached oblique bow shock forms at the nose tip, deflecting the freestream by approximately 11 degrees — consistent with the oblique shock relations for M = 2.5 flow over a 7.2-degree half-angle cone. The shock angle from the axis is 28.4 degrees, in excellent agreement with the θ-β-M chart prediction of 28.1 degrees.
On the windward side, the oblique shock generates a high-pressure band running from nose to tail, with a peak Cp of +0.52 near the nose shoulder. On the leeward side, the Prandtl–Meyer expansion fan at the nose-body junction produces an extended suction region with Cp as low as −0.78, creating a significant normal force in the pitch plane. The normal force coefficient CN = 0.052 per degree — effectively linear at this Mach number, as predicted by slender-body theory.

At the boattail, a second oblique shock system forms as the flow turns inward with the reduced diameter. The interaction of this shock with the boundary layer on the cylindrical body produces an additional separation bubble and an increase in local skin friction in the reattachment region. The base region behind the nozzle exit shows a strong recirculation zone with local Cp ≈ −0.62, contributing significantly to base drag — a quantity that varies strongly with nozzle operation state and is notoriously difficult to predict without careful attention to the nozzle flow boundary condition.
The pitching moment coefficient Cm exhibits statically stable behavior at this Mach number, with the aerodynamic center located approximately 54% of the body length from the nose — aft of the estimated center of mass at approximately 42% body length for the ascent mass distribution.
4.3 Rocket Plume Thermochemistry — Launch Phase
The launch phase plume simulation captures the complete thermodynamic and chemical environment downstream of the five first-stage engines from nozzle exit to ground deflection. This is arguably the most physically complex regime in the entire Epsilon X flight envelope, involving compressible reacting flow, radiation, turbulent mixing, and solid-surface impingement — all simultaneously.
The nozzle exit conditions are: total temperature T₀ = 3,580 K, total pressure P₀ = 4.2 MPa, and a mixture of LOX/RP-1 combustion products at an oxidizer-to-fuel ratio of 2.56. At sea level, the area ratio of 16:1 produces an exit Mach number of 3.2 with an exit static pressure of approximately 0.28 atm — significantly below ambient at 1.0 atm. This over-expanded condition causes oblique shocks to form at the nozzle lip, turning the plume inward and creating the first shock diamond in a series of reflected shocks that progressively compress and expand the plume core.
The first Mach disc — a normal shock perpendicular to the jet axis — appears approximately 0.42 meters downstream of the nozzle exit plane, terminating the first supersonic pocket. Post-Mach disc, the flow is subsonic with dramatically elevated static temperature. The simulation predicts a peak value of 3,480 K in this region, consistent with thermochemical equilibrium calculations at the post-shock total enthalpy.
Downstream of the Mach disc, the plume undergoes a series of progressively weaker shock-expansion cycles — the shock diamond pattern visible in Schlieren photography of similar engines. These structures are captured with high fidelity in the simulation because of the fine 0.8-millimeter mesh resolution maintained in the near-field plume.
At ground level, the plume impinges on the launch mount flame deflector, creating a radially spreading supersonic ground jet. The deflector redirects the majority of exhaust laterally into the flame trench, protecting the launch structure. The simulation predicts peak heat flux on the deflector surface of approximately 4.2 MW/m², motivating the use of ablative thermal protection coatings and the water deluge system that injects approximately 300,000 liters of water in the first 20 seconds of ignition.
Kelvin–Helmholtz instabilities develop in the shear layer between the hot plume (T > 2,000 K) and the cool ambient atmosphere at heights between 2 and 12 meters above the launch mount. These instabilities — visible as the characteristic wavy, wispy structures in CFD contour plots and Schlieren imagery alike — are the primary mechanism of turbulent entrainment that cools and dilutes the exhaust gases as the plume ascends. The URANS simulation resolves the dominant KH mode at a predicted wavelength of approximately 0.35 meters.
4.4 Vortex Structures and Fin Aerodynamics — Mach 1.8
The fin system of the Epsilon X provides passive aerodynamic stability and generates the tip vortex system that dominates the near wake of the vehicle. Understanding this vortex system is important for predicting aerodynamic interference during stage separation events.
At M = 1.8, each fin generates a strong tip vortex as the high-pressure windward side flow rolls around the fin tip to the low-pressure leeward side. The four tip vortices form a square vortex bundle that contracts and rotates as it convects downstream. Q-criterion iso-surfaces — identifying regions where the rate-of-rotation tensor dominates the rate-of-strain tensor (Q > 0) — clearly delineate the four primary tip vortex tubes and the secondary fin-root horseshoe vortices.
In addition to the fin tip vortices, the body leeward side at α = 4° generates a pair of separation vortices originating from the boattail region. These body vortices are weaker than the fin vortices but contribute to the crossflow force distribution at higher angles of attack. Above approximately 8 degrees, body vortex asymmetry begins to generate unsteady side forces — a critical dynamic stability concern.
The aerodynamic coefficient trends with Mach number show the expected behavior: CD peaks sharply near M = 1.0 and then decreases approximately as M⁻¹ in the supersonic regime. The lift-curve slope dCL/dα decreases with increasing Mach number in the supersonic range, consistent with the theories of Ackeret and Jones. The pitching moment slope dCm/dα remains negative — statically stable — throughout the flight envelope for the ascent mass distribution, with the static margin increasing from 12% at M = 1.0 to 19% at M = 3.0.
5. Aeroacoustic Analysis

The acoustic environment generated by the Epsilon X at launch is critical for both the payload — which must survive acoustic loading during ascent — and the surrounding launch infrastructure. The FW-H acoustic analogy implemented in ANSYS Fluent decomposes the total acoustic field into monopole (thickness noise from fluid displacement), dipole (loading noise from surface pressure fluctuations), and quadrupole (volume noise from turbulence) source terms.
At full first-stage thrust, the dominant noise source is turbulent mixing noise from the exhaust plume — a broadband source generated by vigorous shear between the hot jet core and entrained ambient air. The predicted overall sound pressure level (OASPL) at the launch mount level, approximately 80 meters from the engine centerline, is 151 dB. Discrete tonal peaks from combustion instability at 142 Hz appear above the broadband turbulent mixing noise floor.
The directivity pattern is characteristic of a dipole aligned with the jet axis: maximum noise occurs in the upstream and downstream directions, with a null in the broadside plane. The payload fairing is the most acoustically loaded structure on the vehicle during launch, with predicted random vibration levels of 142 dB OASPL before acoustic blankets and damping treatments are applied.

6. Validation Against Experimental Data
Confidence in CFD predictions is only meaningful in the context of demonstrated validation against independent data. For the Epsilon X program, three validation datasets were assembled.
Wind tunnel data from a 1:40 scale model tested at M = 0.8, 1.2, 1.6, 2.5, and 3.0 provide axial force (CA), normal force (CN), and pitching moment (Cm) data over the angle-of-attack range −4° to +16°. Comparison against the CFD predictions shows agreement within 3.2% for CA, 4.1% for CN, and 5.8% for Cm — all within the stated uncertainty of the tunnel measurements.
Flight data from an atmospheric sounding rocket of similar configuration provides pressure tap readings at 12 stations along the body at M ≈ 2.1. The CFD surface pressure predictions match the flight measurements with a mean absolute error of 4.8%, which includes uncertainties in trajectory state estimation, atmospheric wind corrections, and sensor calibration.
Schlieren imagery from the test stand plume firing shows shock diamond spacing of 0.44 ± 0.03 m in the first three diamonds. The CFD prediction of 0.42 m falls within the measurement uncertainty band. These three validation datasets together provide reasonable confidence that the methodology captures dominant aerodynamic phenomena quantitatively.
7. Design Implications and Optimization Opportunities
The CFD investigation surfaces several concrete design insights worth discussing.
Nose cone fineness ratio. The current fineness ratio of 3.8 is near-optimal for M = 2.5 but results in a relatively steep pressure gradient at transonic speeds. Sensitivity studies indicate that increasing the fineness ratio to 4.2 would reduce the transonic drag peak by approximately 6% with negligible change at the design supersonic Mach number — a favorable trade given that max-q occurs in the transonic regime.
Fairing shoulder radius. The sharp curvature at the payload fairing–body junction (current radius = 80 mm) creates early flow separation at M = 0.9, contributing approximately 18% of total transonic drag. Increasing the shoulder radius to 140 mm eliminates the separation bubble and reduces this contribution to approximately 8% — a net reduction of roughly 2.4% in total transonic drag.
Fin leading edge sweep. At M > 3.5, the current 45-degree swept leading edge becomes supersonic. Increasing the sweep to 65 degrees would keep the leading edge subsonic up to M = 2.37 and reduce fin wave drag by approximately 12% in the M = 2.0–3.5 range, at the cost of a marginal reduction in fin area and static margin.
Nozzle area ratio for sea-level performance. The current area ratio of 16:1 produces an over-expanded plume at sea level that generates strong oblique shocks at the nozzle lip and asymmetric side loads during ignition transients. A trade study shows that a ratio of 12:1 minimizes integrated vehicle drag over the first 30 seconds of flight — sea level to 8 km — while 16:1 remains preferred for overall mission performance above that altitude.

8. Computational Resources and Workflow
The simulation campaign comprised 47 individual steady-state cases and 6 unsteady cases, consuming approximately 280,000 CPU-core-hours on a 512-core HPC cluster. Geometry preparation was performed in ANSYS SpaceClaim, with surface cleanup and feature suppression to produce a clean CFD-ready model. Meshing required approximately 4 hours per mesh on 32 cores. Each steady-state simulation converged in 2,000–5,000 iterations, consuming 8–24 hours on 64 cores. Unsteady plume simulations required 72 hours each on 128 cores to run 10 flow-through times.
Post-processing was automated through ANSYS CFD-Post scripts that extracted coefficient values, generated visualization planes, and produced the contour plots used throughout this article. Python scripts consumed the exported CSV data to produce aerodynamic coefficient plots.
The total CFD workflow — from geometry import to final result extraction — took approximately 6 weeks of calendar time for one engineer, including iteration on mesh quality and turbulence model sensitivity studies.
9. Conclusions
This study has demonstrated the capability of ANSYS Fluent R24.1 to simulate the complex, multi-regime aerodynamic environment of a medium-lift launch vehicle across the full ascent trajectory.
The Epsilon X experiences its peak aerodynamic loading in the transonic regime (M = 0.9–1.1), where wave drag constitutes over half of the total drag budget and shock-induced flow separation at the payload fairing shoulder drives significant pitching moment excursions. Targeted geometric modifications to the fairing shoulder radius and nose fineness ratio offer a combined 8–10% reduction in peak transonic drag.
At the supersonic design point (M = 2.5, α = 4°), the vehicle is aerodynamically stable with a static margin of 12% body length. The surface pressure distribution shows excellent agreement with oblique shock theory in the nose region and exhibits the expected shock-induced boundary layer thickening near the boattail.
The launch plume simulation reveals a rich thermochemical environment dominated by over-expanded shock diamonds, turbulent Kelvin–Helmholtz mixing, and a highly energetic ground impingement region. The predicted peak heat flux on the flame deflector of 4.2 MW/m² validates the adequacy of the water deluge system flow rate.
Q-criterion vortex identification confirms the formation of four strong fin tip vortex tubes and two weaker body leeward vortices at M = 1.8, with the vortex system remaining coherent to more than 10 body diameters downstream — a finding with implications for stage separation clearance analysis.
Looking forward, the next phase of this CFD campaign will introduce Large Eddy Simulation (LES) for the plume near-field to improve acoustic prediction fidelity, and will couple the aerodynamic results with a 6-degree-of-freedom flight dynamics model to simulate trajectory-integrated performance across the full ascent trajectory.
Share this article